
Creation year
2016
243 record(s)
Type of resources
Available actions
INSPIRE themes
Provided by
Years
Formats
Representation types
Update frequencies
Status
Service types
Scale
Resolution
geoDescCode
cartografia
geographicCoverage
geographicCoverageDesc
inspirecore
referenceDateRange
denominatorRange
resolutionRange
dataPolicy
openServiceType
dataType
dataFormat
-
Visualization service (WMS) from Map of the monthly maximum air temperature, mean values of the period 1971-2000, obtained by multivariate regression with altitude and distance to the coast, explanatory variables, and ordinary kriging of residues.
-
Visualization service (WMS) from Map of the monthly minimum air temperature, mean values of the period 1971-2000, obtained by multivariate regression with altitude and distance to the coast, explanatory variables, and ordinary kriging of residues.
-
Visualization service (WMS) from Map of the monthly maximum air temperature, mean values of the period 1971-2000, obtained by multivariate regression with altitude and distance to the coast, explanatory variables, and ordinary kriging of residues.
-
Serviço de descarregamento da Carta Hidrogeológica de Portugal à escala 1:200 000, constituído pelas folhas publicadas a esta escala e produzidas por processos digitais em ambiente de Sistemas de Informação Geográfica (Folha 1 e 6).
-
Web Map Visualization, INSPIRE (ISO19128-WMS 1.3.0) compliance, of the monthly mean air temperature, mean values of the period 1971-2000, obtained by multivariate regression with altitude and distance to the coast, explanatory variables, and ordinary kriging of residues.
-
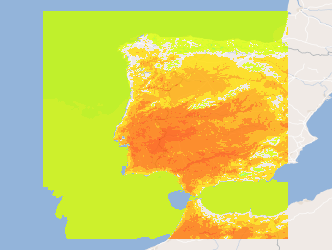
Three-hourly forecast maps of air temperature at 2 meters in Kelvin in the Iberian Peninsula, generated with the AROME model at 12UTC for the next 48 hours. This visualization service includes the individual layers and also a multidimensional layer that brings all of them together.
-
Web Map Visualization, INSPIRE (ISO19128-WMS 1.3.0) compliance, of the annual minimum air temperature, mean values in the period 1971-2000, obtained by multivariate regression with altitude and distance to the coast, explanatory variables, and ordinary kriging of residues.
-
Visualization service (WMS) from monthly minimum air temperature, mean values of the period 1971-2000, obtained by multivariate regression with altitude and distance to the coast, explanatory variables, and ordinary kriging of residues.
-
Visualization service (WMS) from Map of the monthly mean air temperature, mean values of the period 1971-2000, obtained by multivariate regression with altitude and distance to the coast, explanatory variables, and ordinary kriging of residues.
-
Map of the monthly mean air temperature, mean values of the period 1971-2000, obtained by multivariate regression with altitude and distance to the coast, explanatory variables, and ordinary kriging of residues.