
Type of resources
Available actions
Topics
INSPIRE themes
Keywords
Contact for the resource
orgNameSNIG
Provided by
Years
Formats
Representation types
Update frequencies
Status
Service types
Scale
Resolution
geoDescCode
cartografia
geographicCoverage
geographicCoverageDesc
inspirecore
referenceDateRange
denominatorRange
resolutionRange
dataPolicy
openServiceType
dataType
dataFormat
-
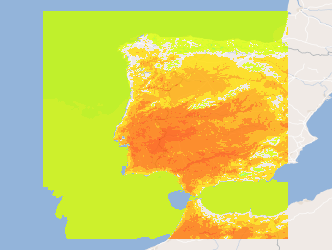
Visualization service (WMS) from Map of the monthly maximum air temperature, mean values of the period 1971-2000, obtained by multivariate regression with altitude and distance to the coast, explanatory variables, and ordinary kriging of residues.
-
Three-hourly forecast maps of air temperature at 2 meters in Kelvin in the Iberian Peninsula, generated with the AROME model at 12UTC for the next 48 hours. This visualization service includes the individual layers and also a multidimensional layer that brings all of them together.
-
Visualization service (WMS) from Map of the monthly minimum air temperature, mean values of the period 1971-2000, obtained by multivariate regression with altitude and distance to the coast, explanatory variables, and ordinary kriging of residues.
-
Visualization service (WMS) from Map of the monthly maximum air temperature, mean values of the period 1971-2000, obtained by multivariate regression with altitude and distance to the coast, explanatory variables, and ordinary kriging of residues.
-
Map of the monthly maximum air temperature, mean values of the period 1971-2000, obtained by multivariate regression with altitude and distance to the coast, explanatory variables, and ordinary kriging of residues.
-
Web Map Visualization, INSPIRE (ISO19128-WMS 1.3.0) compliance, of the annual minimum air temperature, mean values in the period 1971-2000, obtained by multivariate regression with altitude and distance to the coast, explanatory variables, and ordinary kriging of residues.
-
Visualization service (WMS) from Map of the monthly mean air temperature, mean values of the period 1971-2000, obtained by multivariate regression with altitude and distance to the coast, explanatory variables, and ordinary kriging of residues.
-
Visualization service (WMS) from monthly minimum air temperature, mean values of the period 1971-2000, obtained by multivariate regression with altitude and distance to the coast, explanatory variables, and ordinary kriging of residues.
-

Within Portugal's National Biological Sampling Project (PNAB) a set of activities are conducted in the collection, management and use of biological data, collected from the registered commercial fleet in mainland Portugal (fisheries-dependent data) and several research surveys (independent fisheries data). These activities allow the assessment of the state of fishery resources, population structure, distribution and abundance of resources, diversity and dynamics of biological communities associated with the fishery resources and biological studies (growth, reproduction).This resource shows the geographic distribution of blackmouth catshark abundancy index (nr. individuals/hour) registered during the CRUSTACEOS2013 campaign in June 2013.
-
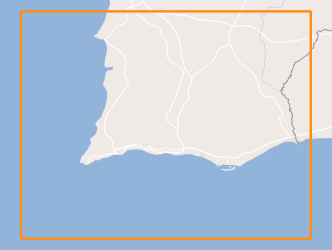
Within Portugal's National Biological Sampling Project (PNAB) a set of activities are conducted in the collection, management and use of biological data, collected from the registered commercial fleet in mainland Portugal (fisheries-dependent data) and several research surveys (independent fisheries data). These activities allow the assessment of the state of fishery resources, population structure, distribution and abundance of resources, diversity and dynamics of biological communities associated with the fishery resources and biological studies (growth, reproduction).This resource shows the geographic distribution of silvery pout abundancy index (nr. individuals/hour) registered during the CRUSTACEOS2013 campaign in June 2013.